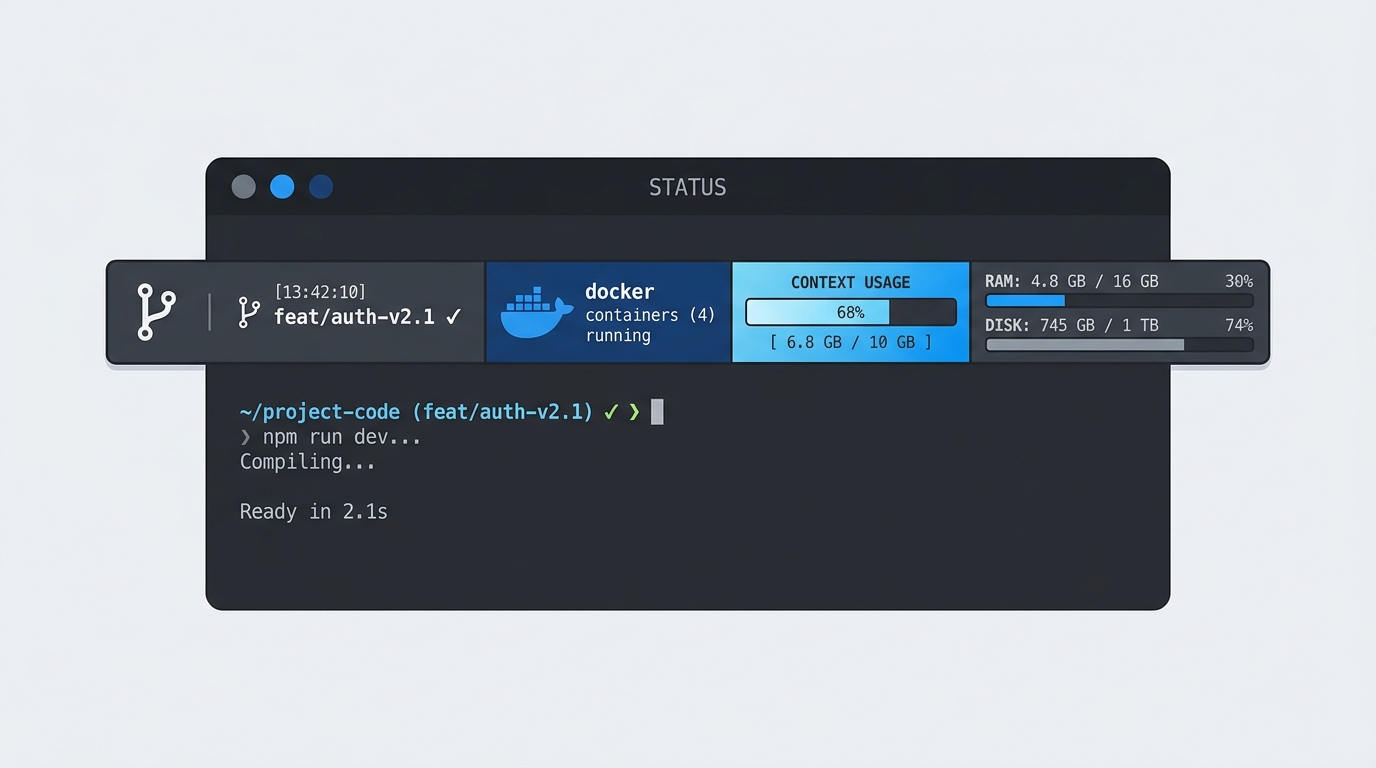
Claude Code ships with a status line out of the box: current directory, maybe the model name. Fine for a first week. After that I wanted to know, at a glance, whether my Docker host was still healthy, how close I was to the context limit, and whether I was about to burn through my five-hour rate limit mid-task. One bash script later, statusline.sh is 1,543 lines long. Nobody asked it to be that big. It got there anyway.
The stdin contract
A Claude Code status line is just a command you register in settings.json:
| |
On every render, Claude Code pipes a JSON blob to stdin and reads whatever you print to stdout back as the status line. The blob includes the model’s display name, the current working directory, context window size and usage, cost, token counts, session duration, lines added/removed, and (a newer addition) rate limit percentages for the rolling 5-hour and 7-day windows. The script’s entire job is: parse that JSON with jq, decide what’s worth showing, and print it fast enough that nobody notices.
That last part is the catch. “On every render” is not an exaggeration. This script runs constantly while you work, so anything slow in it is slow for you, repeatedly.
Caching so the UI doesn’t stall
Some of what I wanted to show isn’t cheap to compute. Checking whether my Docker containers are healthy means SSHing into the box that runs them. Checking disk and memory means shelling out to df and free. Do that on every single render and the status line becomes a reason to switch terminals while you wait.
The fix is unglamorous: flat files in /tmp as a cache, with a staleness window per component.
| |
Docker and RAM get a 30-second window, the broader system block (hostname, uptime, disk, load average) gets 60. Pick too short a window and you’re back to paying the SSH round trip constantly. Too long and the status line tells you Docker is fine thirty seconds after it wasn’t. Those two numbers are the only real tuning knobs in the whole file, and I arrived at them by watching how often I actually looked at that part of the line versus how often something changed.
Bash 3.2, the silent constraint
I write and test this on Linux, but Claude Code also runs on macOS, which still ships bash 3.2 by default (the last GPLv2 release, frozen there since Apple stopped shipping GPLv3 software). That rules out associative arrays, ${var,,} case conversion, and a few other conveniences bash 4+ developers take for granted.
The effect shows up in places that look needlessly manual. The progress bar for context usage doesn’t use brace expansion or printf '%.0s' tricks, it builds the filled and empty segments character by character in a loop:
| |
Clunky, but it’s UTF-8 safe and it runs identically on a 3.2 and a 5.x bash. The comment above get_context_message spells out the constraint directly: “Bash 3.2 compatible: uses bash arrays.” Once you know to look for it, half the odd-looking code in this file is a compatibility tax, not a style choice.
Two git calls instead of seven
The git section carries its own comment: “Optimized - 7 calls reduced to 2.” Early versions called git status, git branch, git rev-list and a couple more, separately, per render. Since this runs on effectively every turn, each extra subprocess is a tax paid continuously rather than once. The current version gets branch name, ahead/behind counts, and dirty-file totals out of two calls and parses the combined output with IFS scoped locally so it doesn’t leak into the rest of the script.
It’s a small thing, but it’s the kind of small thing that only becomes visible once you’re running a script dozens of times a minute instead of once at shell startup. Code that would be fine as a one-off diagnostic script turns into a performance problem purely because of how often it gets invoked.
What actually ends up on screen
Four lines, in practice:
- Timestamp, Claude Code version, model name, current directory, and rate limit percentages (only shown once usage is worth knowing about).
- A rotating one-line message, session cost, turn count, duration, and Docker container health (
running/total, plus a red!Nif any are unhealthy). - Lines added/removed and git state for the current repo.
- Hostname, uptime, RAM, disk free on two mounts, and load average relative to core count.
Everything that can go wrong gets the same red/orange/green treatment at fixed thresholds: RAM over 80%, disk over 85%, load at or above core count, context usage past four tiers from “very low” to “critical.” Consistent thresholds across completely different metrics make the line scannable without reading the numbers, which is the entire point of a status line in the first place.
Was it worth 1,500 lines
Mostly yes, with the caveat that the growth was never a single decision. Each addition was small and justified on its own: one more thing I kept checking by hand, pulled into the script instead. The Docker check exists because I got tired of remembering that my containers might be unhealthy. The rate limit display exists because I hit a 5-hour cap mid-task once and would rather see it coming. None of it was “let’s build a monitoring dashboard,” and yet here we are, with a bash script that fact-checks my infrastructure every few seconds so I don’t have to ask it to.
If you’re building your own, the two lessons worth stealing are the caching pattern and the deliberate bash-3.2 discipline. Everything else is just accretion, the normal kind that happens to any tool you actually use daily.